Assumption

Sometimes in life you have to make estimations. I have always been one to want precise answers but the truth is you are not always going to be able to get the precise results that you want. In reality, it’s just not a realistic goal. Many times you will have to make assumptions and estimations in order to obtain any results close to the actual results. This class has put me in situations that have tested my ability to make estimates and assumptions in order to make calculations. I will provide three example of assignments that test this acquired knowledge of mine.

The first example is the assignment “team demographics.”  The purpose of this assignment was to create a target audience for our serious game. We wanted our target audience to be people who cared about world problems and had an interest in disaster preparedness. However, there is no statistics that provide us with the people who care about world problems and disaster preparedness. In order to get past this obstacle without going around and asking everyone if they care about these things or not we had to use our collective knowledge and past experience in order to come up with characteristics that we think people that care about the planet and disaster preparedness would have in common. We decided to assume that three in five people cared about world issues. We also assumed that most sophomores are between the ages of 18 and 24. Another thing we assumed is that college people would have a drive to learn.

http://mikey.ourdigitalplanet.net/team-demographics/

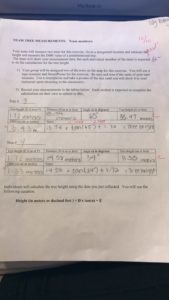
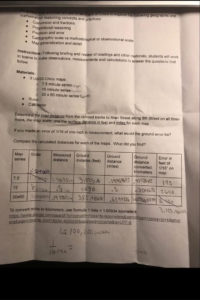
The second example is “map and scale reasoning” assignment. In this assignment we learned about the importance of estimation. The purpose of this assignment was to find the distance between Main Street in Chico and the railroad tracks on three maps each having different scales. The smallest map was very challenging. It was so small that it was very hard to be precise on the measurements. We must be careful to not carelessly estimate. This assignment showed that even one sixteenth of an inch of in measuring could mean that our calculations are off by over a thousand feet. We learned that when calculating distances using maps, it is important to not over or underestimate. We also learned that it is beneficial to use the largest map in order to get the most precise measurements. This will give us the most accurate calculations.

http://mikey.ourdigitalplanet.net/map-and-scale-reasoning/

My final example is the “bus story” assignment. This assignment proved that it is possible use calculations to make accurate measurements. This assignment was one of the first ones we did in this class. We rode the bus’ full  route around Chico. Before this we were asked to estimate the amount of time the bus would take to complete the route with only the map of the route. We used our estimation skills as well as math skills to assume the bus’ average speed and the total distance to estimate the amount of time that it would take for the bus to complete it’s full cycle. We took pictures along the way to create a story map of our travelings.

http://novum-orbis.ourdigitalplanet.net/81-2/

Calculations

Calculation is a skill level that widely varies it is used in everyday life, for example: calculating the cost of all your groceries, and it is used in rocket science. Whatever level I plan to use it at, it is an important skill. This skill was enhanced in this class because it strengthened my ability to perform statistical calculations as well as trigonometry. I will provide three example of of how I use my ability to make calculations

The first example is the “tree measurement assignment.” in this assignment our class was put into groups of three or four and given a map of the location of three specific trees on campus. We were to find the locations of all three of the trees and make two measurements. We had to find the angle of the the tree from a specific distance and measure that distance from the spot where the angle measurement was made to the tree. We took these measurements and used them to make a triangle. We had the distance of one side of the triangle and two angles one was a 90 degree angle because the tree is growing straight up from the ground and the other angle was the the one we measured with our phones. We used trigonometry and our phones to solve for the height of the tree making sure that our calculators were in degrees not radians. This was a refreshing exercise because it has been years since I had taken any trigonometry

http://mikey.ourdigitalplanet.net/tree-measurements-assignment/

The second example is the “ map and scale reasoning” assignment. The type of math done in this assignment was conversions with ratios. We had three different scaled maps and had to measure the distance from Main Street in Chico to the railroad tracks. Each map had a ratio on it that looked something like this, 1:100,000 (cm). This means that one centimeter on the map represents 100,000 centimeters of actual land. If we measured 3.5 centimeters on the map, we had to take that measurement and convert it using the ratio. This would be 350,000 centimeters. We then had to convert this amount into feet. We had to perform these calculations for all of the three maps as well as calculate the error at 1/16 of an inch. We did this just to see how far we would be off if if our measurement was off by even a sixteenth of an inch.

http://mikey.ourdigitalplanet.net/map-and-scale-reasoning/

The final example is “the bus story” assignment in this assignment we estimated the amount of time we thought it would take the bus to complete it’s route and end in the same place as it started. Before we got on the bus we had to figure out how to calculate the amount of time without any help on how to do so. Then after we had we had completed the bus route, and knew the correct answer, our professors showed us how to calculate an estimate of the time as accurate as possible. We found that to calculate the time it would take we first needed to find the total distance the bus was traveling. After that we needed to estimate the average speed that the bus would be driving at, this was the speed limit in town, though it would be a bit slower because there are many times where the bus has to wait a bit and speed up and slow down. We use these two factors to solve for time.

http://novum-orbis.ourdigitalplanet.net/81-2/


Application and analysis

What good does information do if you don’t use it? The main purpose of collecting information is for analysis and application. This is the process of taking this information and deciding what it means and from there deciding how to apply what you have learned from the analysis of the data. This class has helped in making me confident in understanding data and applying the knowledge I extract from the data to make conclusions or changes. I will provide three examples of assignments in which I display my skills of application and analysis.

The first example is the “design crash course” assignment. This assignment was very interesting in the sense that it asked me to do and think about things in ways that I had never done and thought about. The objective of this crash course was to create an object to symbolize the gift giving process of a partner’s last gift giving experience. In order to successfully do this, we had to collect data from our partner regarding their last experience of giving gifts. Once all the data was collected, We had to use it to then decide how to create an object to represent that experience. The thinking involved was so abstract that it greatly interested me. My partner was giving a gift to a long-time friend that’s moving away from her. I had asked many questions regarding how this experience felt for her and what it meant to her. From analyzing the data that I collected, I came to the conclusion that her gift giving experience was about growing up and being genuine. There were a few other aspects that resulted from this growth that I symbolized in my invention. My invention that described the gift giving process was a ring in the shape of a tree made from pipe cleaner. The trunk was brown with green leaves. There was a few different colored fruits that grew from the tree in the form of small fuzzy balls.

http://mikey.ourdigitalplanet.net/design-thinking-crash-course/

My second example is the “beta test survey.” the analysis and application of this data is crucial to our serious game. In this assignment we collected data from the first people to test out our game. We used this data and represented it in a mathematical form (graphs). From there we analyzed the data and came to the conclusion that our game needed some bugs to be fixed. The first was that some of our questions were too ambiguous. We not only collected data on the effectiveness of our game but we also had a pre-survey in which we asked questions that would tell us if the people testing our game matched the personalities and qualities of our target audience. This way we could validate the opinions of the individuals about our game. For example, if there was someone that did not care much about being prepared for disasters and did not take interest in trivia games or learning by being tested then they did not fit our target audience. This means that the game we created was not intended for that person therefore we need not change our game based upon the data collected from that person.

http://mikey.ourdigitalplanet.net/beta-test-surveys/

The final example that I will display is the “memory and learning research presentation.” In this assignment we had to read an article that consisted of research and statistics done on the different types of learning and memorization techniques from this information we created a slideshow to summarize the main learning techniques. The final slide spoke about how we were going to apply this newly-learned information to our serious game. The article mainly talked about how most often people do not learn unless they want to and and are interested in the topic. Form memorization there are many techniques that people use. One of the best techniques that I often use myself is by asking myself the questions until I can easily answer them. We decided to apply this knowledge to our game by creating a trivia style where the main piece of the game is answering disaster preparedness questions. We added the component of phoning a friend in one didn’t know the answer in order to make the game more dynamic and involving that way people would have more fun and in turn, learn more.

http://mikey.ourdigitalplanet.net/learning-methods/

Representation

Throughout my life, I had always had a tough time reading graphs, but once I finally started to understand their formating, I realized the importance of them. I realized just how much data presented in mathematical forms can display solid statistical information to prove points and draw conclusions. Being able to present information in mathematical forms is very helpful because it can show you correlations that you’ve never even noticed. I will present three examples of where I display my keen ability to present information in mathematical forms

My first example is in the assignment, “team demographics.” The purpose of this assignment was to find the target audience of our serious game by narrowing down to the audience size. We had to create a graph that matched our process of creating our target audience. Upon looking over the assignment. Once mat notice a color-coated graph consisting of three rectangles, starting largest and ending smallest in the middle of the larger triangles. We designed this graph in this format because we wanted each rectangle to represent a specific population. The next triangle will narrowed because it will have another aspect in common. The final smallest triangle will be our target audience in which shares three characteristics. The first being the number in people in Chico, the second is all of those people that attend Chico State, and the third that they are sophomores

http://mikey.ourdigitalplanet.net/team-demographics/

My second example will be the assignment “beta test surveys” which was one of my favorites. This assignment was one of my favorites because the graphs were formed out of data that we collected for the purpose of enhancing our game in order to achieve our desired learning outcome. Many of the previous times I had constructed graphs, I had no purpose for them except for the fact that we were required to create one for a class. This was one of the first times that I was genuinely interested in what the data had to tell me. In this assignment we had given surveys to the people in our class that had participated in the testing of our game. Our hope was that they had learned about being prepared for disasters and understanding that these disasters are happening constantly in some part of our world. From these surveys we created graphical representations to consolidate our data in order to analyze the results. From there we can alter our game based upon the evaluations of the collected data. This data also tells us what type of people we surveyed. In this assignment, me created 15 graphs that all reflected the answers to the questions from the beta test surveys.

http://mikey.ourdigitalplanet.net/beta-test-surveys/

The final example will be the assignment “summarizing data.” In this assignment each person in their group collected information about the apps on their phones. Once each person completed their data collection, we got into groups and then were challenged with the task of consolidating all the data we collected. We decided to achieve this by listing all the common apps, from there we listed all the common ways of categorizing the apps. Then we finished by adding up the storage of the apps and dividing it up between the number of people that had each app to find the average. For the rest of the categories we wrote the number of yes and no answers.

http://mikey.ourdigitalplanet.net/summarizing-data/

Interpretation

The ability to explain information that is presented in mathematical form is crucial. I didn’t realize how helpful it is to have a strong understanding of mathematical data was until I was able to apply it this year. This strong understanding is what allows you to use the data to your advantage. Here are some examples where I display my ability to explain mathematical information.

The first example is our map and scale reasoning assignment. In this assignment we needed to measure a map with a ruler and convert this small scale in to the actual distance between the two places measured. We were given three different map scales and had to measure from Main Street in Chico to the railroad tracks. Each of the maps   In this assignment we interpreted our initial measurement explaining how these few inches could represent such a large amount of land. At the completion of this assignment we gathered into a group and were asked to explain the map scale ratio and what it represented. We explained that in each map, one inch or one centimeter represents a much larger amount of inches or centimeters of actual land. We also understood that the smaller maps had smaller measurements represent larger amounts of land than the larger measurements

http://mikey.ourdigitalplanet.net/map-and-scale-reasoning/

The second example is our  “Interpreting graphs” assignment. I really enjoyed this assignment because it portrayed just how specific maps can be. In this assignment we were given various graphs and various scenarios. Each graph was a representation of a scenario and the objective was to match the graphical representation with the correlating scenario. In order to successfully complete the assignment we had to know how time and distance correlated with negative and positive slopes of the graph. If one knew how speeding up, slowing down, and changing directions changes the slope of the graph, then he/she could then correctly interpret each graph. This exercise showed me just how important is it is to understand that graphs tell a very precise story in an equally-precise language and the only way to know the story is by speaking the language.

http://mikey.ourdigitalplanet.net/interpreting-graphs/

The final example that I will provide is the assignment named “team demographics.” The purpose of this assignment was to get my team to create a target audience for our serious game. This assignment appeared challenging at first because we weren’t sure at all what our game was going to be at the time. However, it became easier upon explanation. We were supposed to start wide and circle in on the target audience. At the completion of this assignment there was a graphical representation created that each team had to interpret to the class. Our graph consisted of a large rectangle, with two consequently smaller rectangles. We explained that the first rectangle included all the residents in Chico, the next rectangle consisted of only Chico State students and the smallest one only consisted of Chico State sophomores. This created a target-shaped graph.

http://mikey.ourdigitalplanet.net/team-demographics/